Have you ever invested millions of dong buying biochar hoping to improve soil and increase yields, only to have the results fall short of expectations? According to a 2023 survey by the Institute of Soil Science and Fertilizers, nearly 40% of farms using biochar in Vietnam saw no noticeable difference after six months of application. The main reason is not that biochar is ineffective, but that product quality is inconsistent and users lack understanding of the key nutritional indicators.
In reality, biochar is not a uniform product. Its quality depends entirely on the feedstock, the pyrolysis temperature, and the production process. A low-quality biochar product not only wastes money but can also harm arable soil, disrupt nutrient balance, and affect crop growth.
This article will help you clearly understand the 6 most important nutritional indicators to assess biochar quality before investing. From there, you'll be confident in selecting a suitable product, optimizing its effectiveness, and achieving sustainable soil improvement goals.
Why Doesn't Every Biochar Deliver the Expected Results?
The current state of biochar use in Vietnamese agriculture
Over the past five years, biochar has become a hot keyword in Vietnam's agricultural community. From coffee-growing areas in the Central Highlands to the rice fields of the Mekong Delta, many farms have begun experimenting with this product in hopes of improving soil fertility.
However, actual results vary widely. Some households report a 15–20% increase in yield and a significant reduction in chemical fertilizer use. But there are also many cases where no change is seen, and some even experience yellowing leaves and stunted growth in the early stages after applying biochar.
The main cause is that the biochar market in Vietnam is not tightly regulated. Many products are produced manually, without quality testing, and are sometimes just ordinary charcoal ground up and packaged.
Common mistake: Focusing only on price while overlooking quality
Most farmers, when buying biochar, usually only ask about the price and compare suppliers. Cheaper products are often preferred, especially when cultivation areas are large and initial investment costs are high.
According to Mr. Nguyễn Văn Thành, a coffee farmer in Đắk Lắk: "The first time I bought biochar at 3,000 VND/kg, nearly half the price of the 8,000 VND/kg type. But after three months of application, the plants showed no difference. Later I learned that the cheap type was just ordinary charcoal, not technically processed."
This mistake stems from a lack of understanding of the technical indicators for evaluating biochar quality. Just like when buying fertilizer you pay attention to NPK content, the same applies to biochar — specific criteria are needed for assessment.
The decisive role of nutrient indicators in biochar effectiveness
Nutritional indicators not only reflect the quality of biochar but also determine its mechanism of action on agricultural soil. A product with a high carbon content will create good porosity and retain water effectively. A reasonable C/N ratio will avoid nitrogen competition with crops.
Understanding these indicators helps you:
- Choose the right product appropriate for your soil and crops
- Calculate dosage apply accurately
- Combine appropriately with other fertilizers
- Predict results and monitor return on investment
This is the key to turning biochar from an ambiguous cost into a truly effective soil improvement tool.
What Is Biochar and Why Are Nutritional Indicators Important?
Definition of biochar and its effects on agricultural soil
Biochar is a type of charcoal product produced by the process pyrolysis (pyrolysis) of organic materials such as rice husk, rice hull, sawdust, coffee husks, and agricultural residues at high temperatures (300-700°C) under oxygen-limited or oxygen-deficient conditions.
Unlike ordinary combustion, the pyrolysis process retains most of the carbon in a porous structure, creating a material with an extremely large surface area (which can reach 300-500 m²/g). This structure is like a "sponge" at the microscopic level, capable of:
- Water absorption and retention: Increases soil moisture retention by 15-30%
- Nutrient retention: Prevents fertilizer leaching
- Improves soil structure: Increases aeration, reduces compaction
- Creates an environment for microorganisms: Provides shelter for beneficial bacteria
The difference between high-quality biochar and low-quality biochar
Not every product that goes through the burning process becomes high-quality biochar. The difference lies in several factors:
High-quality biochar:
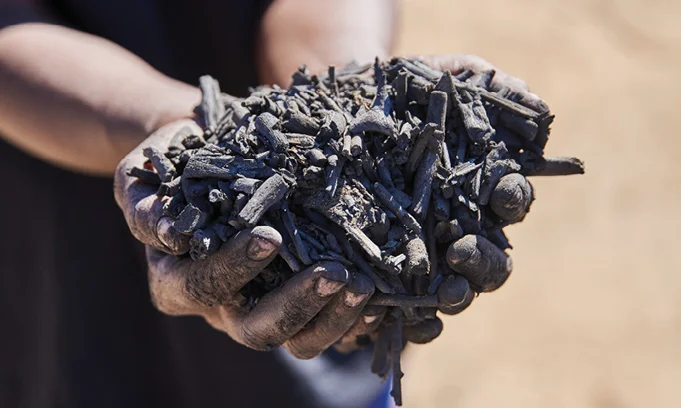
- Shiny black color, clearly porous structure visible to the naked eye
- Light, easily crumbly but not excessively dusty
- No burnt odor or chemical smell
- When soaked in water, it absorbs quickly and retains water for a long time
- Has a certificate of analysis for technical parameters
Low-quality biochar:
- Gray, brown, or black but uneven in color
- Heavy, hard, difficult to break, or too fine like dust
- Has a burnt, smoky, or unusual odor
- Does not absorb water or absorbs water very slowly
- No information about composition or origin
The relationship between nutrient composition and soil improvement capability
The nutrient composition of biochar determines specific role that it plays in the farming system. A product high in carbon but low in nutrients will primarily improve the soil's physical structure, while NPK-enriched biochar can both rehabilitate the soil and provide nutrients.
For example:
- Biochar from rice husks: Often has high silica content, good for rice, increases lodging resistance
- Biochar from coffee husks: Rich in potassium, suitable for fruit trees
- Biochar from wood: High carbon, good CEC, ideal for long-term soil restoration
Therefore, the measuring and understanding the indicators helps you choose the right type of biochar for specific uses.
Why measure these indicators before application?
Applying biochar without knowing its composition is like "shooting in the dark". Potential risks include:
Risk 1: Temporary nitrogen deficiency Biochar with a C/N ratio that is too high (>100:1) will cause soil microbes to draw nitrogen from the soil for decomposition, causing plants to be nitrogen-deficient during the first 2–3 months.
Risk 2: pH imbalance High-pH biochar (>10) applied to alkaline soils will worsen alkalinity, preventing plants from absorbing micronutrients.
Risk 3: Wasted investment Low-quality products will not deliver the expected results, causing you to lose confidence in this technology.
Therefore, check the indicators before buying is the first and most important step in the journey to using biochar effectively.
Indicator 1: Carbon Content (C) - The Backbone of Quality Biochar
The role of carbon in biochar structure and water-holding capacity
Carbon is the "soul" of biochar. A high carbon content means the pyrolysis process was complete, removing most volatile compounds and creating a stable carbon structure.
The carbon structure in biochar is in the form of a multi-layered porous network:
- Large pores (macropores): Helps drainage and aeration
- Medium pores (mesopores): Retain water and nutrients
- Small pores (micropores): Adsorb ions and microorganisms
Thanks to this structure, biochar can hold water up to 2-5 times its weight This is especially beneficial for sandy or light soils, or under drought conditions.
Minimum carbon content standard (% by dry weight)
According to the international standard of the International Biochar Initiative (IBI), quality biochar should have:
- Minimum carbon content: ≥60% (by dry weight)
- Premium biochar: 70-85%
- Below 50%: Not considered quality biochar
In Vietnam, because production technology is still simple, many products only reach 40-50% carbon. These are essentially ordinary charcoal and are much less effective at soil amendment than standard biochar.
Important note: Carbon content isn't necessarily better the higher it is. Above 90% is often activated carbon, expensive and not necessary for agricultural purposes.
How carbon affects the soil's nutrient retention capacity
The carbon in biochar has negative surface charge, enabling the attraction and retention of positively charged nutrient ions such as NH₄⁺, K⁺, Ca²⁺, Mg²⁺. This is precisely the mechanism behind the CEC index (to be discussed later).
When carbon content is high:
- Increased surface area → more adsorption sites
- High carbon stability → effectiveness lasting for decades
- Good water retention → dissolved nutrients are not washed away
A study at Ho Chi Minh City University of Agriculture and Forestry found that biochar with 75% carbon content helps reduce nitrogen fertilizer leaching by 35% compared to soil without biochar.
Simple methods for testing carbon content
In the laboratory, carbon content is determined by combustion or elemental analysis. However, at home, you can make a rough estimate using:
Method 1: Check the color
- Shiny, uniform black: High carbon (>70%)
- Grayish black: Medium carbon (50-70%)
- Brown, gray: Low carbon (<50%)
Method 2: Check the weight
- Grab a handful of biochar — if it's very light and porous: High carbon
- Heavy and dense: Low carbon, contains many impurities
Method 3: Check buoyancy
- Put biochar in water; a good product will float or remain suspended initially due to air in the pores
- After soaking, it will gradually sink
- If it sinks immediately: poor porous structure, low carbon
Recommendations: Always ask the supplier to provide a certificate of analysis from reputable laboratories to obtain accurate data.
Indicators 2 & 3: C/N Ratio (Carbon/Nitrogen) and Nitrogen (N) Content
Ideal C/N ratios for each crop and soil type
The C/N ratio (carbon/nitrogen) is the second most important indicator, determining decomposition rate and short-term impact of biochar on soil.
Basic principle:
- High C/N (>50:1): Slow decomposition, microorganisms will draw extra N from the soil
- Medium C/N (20-40:1): Balanced, ideal for most crops
- Low C/N (<20:1): Fast decomposition, releases N immediately
Recommendations by crop type:
| Crop type | Ideal C/N ratio | Reason |
|---|---|---|
| Vegetables and short-duration crops | 20-30:1 | Require rapid N availability, short cycles |
| Rice, maize (corn) | 30-40:1 | Balance between soil improvement and N supply |
| Coffee, rubber, pepper | 40-60:1 | Long-term soil improvement; N supplemented via other fertilizers |
| Fruit trees | 30-50:1 | Depends on the growth stage |
Risk of nitrogen competition when the C/N ratio is too high
This is the biggest trap when using biochar that many farmers do not know about. The phenomenon "nitrogen immobilization" occurs when:
High biochar C/N → Soil microbes decompose → Require more N → Draw N from soil and fertilizer → Crops become N-deficient → Yellowing leaves, poor growth.
According to Mr. Trần Văn Hùng, a vegetable farmer in Lâm Đồng: "The first time I applied biochar, after 2 weeks the vegetables started to yellow even though I had applied enough nitrogen fertilizer. After asking an expert, I found out the biochar I bought had a C/N of up to 80:1, too high for vegetables."
Signs of nitrogen competition:
- Plants yellowing from older leaves to younger leaves
- Growth slows 2-4 weeks after applying biochar
- The issue resolves itself after 2-3 months when decomposition is complete
Nitrogen content and immediate nutrient-supplying capacity
Conventional biochar has very low nitrogen content (0.3-1.5%) because nitrogen volatilizes during high-temperature pyrolysis. This is a major difference compared to compost (usually 1.5-3% N).
Practical implication:
- Biochar is not a primary source of nitrogen
- Its main role is to retain nitrogen from fertilizers and other organic manures
- Should be combined with nitrogen fertilizer or organic manure to ensure nutrition
Nitrogen-enriched biochar (enriched biochar) is a new trend:
- Soak biochar in liquid organic fertilizer solution or diluted urine
- Mix biochar with livestock manure and incubate for 2-4 weeks
- N content can increase to 2-4%
How to balance the C/N ratio when applying biochar combined with organic fertilizer
Golden rule: When using biochar with a high C/N ratio, add extra nitrogen sources.
Formula to calculate supplementation:
- If the biochar has a C/N ratio of 80:1, you want to reduce it to 30:1
- Add nitrogen-rich fertilizers (such as nitrogen fertilizers or animal manure)
Practical methods:
Method 1: Mix before applying
- 100 kg biochar (high C/N) + 20-30 kg well-composted manure
- Keep moist for 2-3 weeks before applying to the soil
- The overall C/N ratio will decrease to a safe level
Method 2: Increase the nitrogen fertilizer dose during the first 2 months
- Increase nitrogen fertilizer by 20-30% compared to normal
- After 2-3 months, gradually return to the original level
Method 3: Use activated biochar
- Soak biochar in a liquid NPK fertilizer solution for 1-2 days
- Let drain, then apply immediately
- Biochar already 'charged' with nutrients, reducing the risk of competition
Indicators 4 & 5: Phosphorus (P) and Potassium (K) Content - The Productivity Duo
The role of phosphorus in root development and flowering/fruiting
Phosphorus (P) is an essential element for root development, flowering and fruiting. In biochar, P content depends on the original feedstock:
High P sources in biochar:
- Biochar from animal bones: 5-15% P₂O₅
- Biochar from livestock manure: 2-5% P₂O₅
- Biochar from wood, rice husk: <0.5% P₂O₅
P in biochar exists as mineral phosphates, less likely to be fixed by iron and aluminum in acidic soils compared to chemical phosphate fertilizers. This is a major advantage, especially for acid sulfate soils in the Mekong Delta.
Benefits of P in biochar:
- Promotes healthy roots, increases nutrient uptake
- Stimulates flowering and uniform fruit set
- Increases fruit sugar content, improves quality
Potassium and crop stress tolerance
Potassium (K) plays an important role in water regulation, sugar synthesis, and enhanced resistance of the plant. Biochar from agricultural residues is often richer in potassium than biochar from wood.
Potassium (K) content by source:
- Biochar from coffee husks: 3-8% K₂O
- Biochar from rice straw: 2-5% K₂O
- Biochar from rice husks: 1-3% K₂O
- Biochar from wood: <1% K₂O
K in biochar exists in the form of readily soluble, plants absorb it quickly. However, this also means K is easily leached if the soil drains too quickly.
Effects of K on crops:
- Enhances tolerance to drought, cold, and pests/diseases
- Improves fruit quality: sweetness, color, firmness
- Helps plants use water more efficiently
Minimum P-K content in high-quality biochar
According to agronomy experts' recommendations, high-quality biochar should have:
Minimum standard:
- Phosphorus (P₂O₅): ≥0.5%
- Potassium (K₂O): ≥1.0%
Premium level (enriched biochar):
- P₂O₅: 2-5%
- K₂O: 3-8%
The situation in Vietnam: Most commercial biochar has P < 0.3% and K < 0.8%, much lower than the standards. This is why biochar needs to be combined with other fertilizers, and cannot completely replace NPK fertilizers.
Which growth stages is P-K-rich biochar suitable for
The selection of P-K-rich biochar should be suited to the growth cycle of the plant:
Stages requiring high P:
- Seedling stage (0-3 months): Root development
- 2-3 weeks before flowering: Stimulate floral bud differentiation
- After harvest: Plant recovery and preparation for the next crop
Stages requiring high K:
- Fruit set to ripening: accumulation of sugars and color
- Dry season/drought: increases water retention
- When plants are stressed (pests, diseases, adverse weather)
Application recommendations:
- Basal application: Use P-rich biochar to promote root development
- Topdressing (side dressing): Supplement with soluble K fertilizer or K-rich biochar
- Perennial crops: Apply balanced P-K biochar once per year; supplement with chemical fertilizers according to growth stages
Ways to enhance P-K in biochar using activation methods
If the biochar you buy has low P-K, you can enrich it using simple methods:
Method 1: Soak in NPK solution
- Dissolve 1 kg of NPK 16-16-8 in 20 liters of water
- Soak 5 kg of biochar for 24 hours
- Remove, drain, apply within 1 week
Method 2: Mix with rice husk ash/wood ash
- Ash rich in K (20-40% K₂O) and P (3-8% P₂O₅)
- Mix 70% biochar + 30% ash
- Keep moist for 1 week before use
Method 3: Compost with farmyard manure
- Mix 60% biochar + 40% well-composted manure
- Pile up, cover with a tarp, and let sit for 3-4 weeks
- Biochar will absorb nutrients from manure
This method not only increases P and K but also increases N content and beneficial microorganismscreating an extremely effective biochar-compost hybrid product.
Indicator 6: pH and Cation Exchange Capacity (CEC)
Why biochar pH directly affects soil pH
The pH of biochar varies greatly depending on the feedstock and the pyrolysis temperature:
- Biochar produced at low temperatures (300-400°C): pH 6-7
- Biochar produced at high temperatures (500-700°C): pH 8-10
- Wood biochar: Usually has a higher pH than biochar from agricultural residues
When biochar is applied to soil, it will affect soil pH in the direction of:
- High-pH biochar (>8) → Raises soil pH (liming effect)
- Neutral-pH biochar (6-7) → Little effect on soil pH
Depending on soil conditions, this can be an advantage or a disadvantage:
Acidic soil (pH < 5.5): High-pH biochar is an advantage
- Neutralizes acidity, reduces aluminum toxicity
- Increases uptake efficiency of P, Ca, Mg
- Stimulates microbial activity
Alkaline soil (pH > 7.5): High-pH biochar is a disadvantage
- Causes further alkalinization
- Plants have difficulty absorbing iron, zinc, manganese
- Choose low- or neutral-pH biochar
Select biochar pH suitable for each soil type (acidic/alkaline)
Selection principles:
| Soil type | Soil pH | Suitable biochar pH | Recommended biochar type |
|---|---|---|---|
| Acidic soil | <5.5 | 8-10 | Wood biochar, high-temperature pyrolysis |
| Slightly acidic soil | 5.5-6.5 | 7-9 | Most types of biochar |
| Neutral soil | 6.5-7.5 | 6-8 | Medium-temperature biochar |
| Alkaline soil | >7.5 | 6-7 | Biochar from rice husk and residues, low-temperature pyrolysis |
Special note: In the Mekong Delta, many areas have acid sulfate soils (pH 3-4.5). High-pH biochar (9-10) has the effect rapidly ameliorate, reduce aluminum and sulfur toxicity, creating favorable conditions for crop growth.
CEC - Measure of biochar's nutrient-holding capacity
CEC (Cation Exchange Capacity) is the measure of the amount of positively charged ions (NH₄⁺, K⁺, Ca²⁺, Mg²⁺) that biochar can attract and retain on its surface.
Unit of measurement: cmol/kg (centimoles of positive charge per 1 kg of biochar)
Mechanism of action:
- The biochar surface carries a negative charge
- It attracts positively charged nutrient ions
- Holds them, preventing leaching
- Releases them slowly for plant uptake
CEC of biochar gradually increases over time as biochar becomes oxidized in the soil. Fresh biochar may have a CEC of 10-20 cmol/kg, which can increase to 40-60 cmol/kg after 1-2 years.
Relationship between high CEC and fertilizer use efficiency
High CEC brings clear economic benefits:
Benefit 1: Reduced fertilizer losses
- High CEC → Keeps NH₄⁺ and K⁺ from leaching
- Reduces required fertilizer amounts by 20-40%
- Reduce input costs
Benefit 2: Prolong nutrient supply duration
- Nutrients are released slowly
- Plants absorb steadily, not "hungry" between fertilizer applications
- Increase fertilizer use efficiency (FUE)
Benefit 3: Improve the environment
- Reduce water pollution from nitrate leaching
- Reduce greenhouse gas emissions (N₂O)
A study at the Vietnam Institute of Agricultural Science and Technology found: Soil amended with biochar with a CEC of 45 cmol/kg can reduce nitrogen fertilizer by 30% while still achieving equivalent yields.
Minimum CEC standard for quality biochar
Classification by CEC:
- Low CEC (<20 cmol/kg): Fresh, unactivated biochar, limited effectiveness
- Medium CEC (20-40 cmol/kg): Good-quality biochar, suitable for use
- High CEC (>40 cmol/kg): Activated or well-aged biochar, high effectiveness
Recommendation: Choose biochar with CEC ≥ 30 cmol/kg to ensure effective nutrient retention.
Ways to increase biochar's CEC:
- Compost biochar with organic manure for 3-6 months before use
- Mix biochar with soil and water regularly to enhance oxidation
- Use chemically activated biochar (soaked in a mild acid solution)
How to Check and Choose Biochar Based on 6 Indicators
Request the supplier to provide a quality analysis report
This is the first and most important step when buying biochar. A reputable supplier will be willing to provide:
Certificate of analysis from the laboratory including:
- Name of the laboratory (ISO 17025 accreditation is preferred)
- Date of sampling and analysis
- Parameters: C, N, P, K, pH, CEC, moisture, ash
- Analytical method
If the supplier does not have a certificate:
- That's a warning sign regarding quality
- Request a sample for independent testing
- Or find a more reliable supplier
Quick tip: Don't hesitate to request documentation. It's a legitimate right of the buyer, especially when investing in large quantities.
Parameters required in a biochar certificate
Complete checklist:
✅ Carbon content (C): ≥60%
✅ C/N ratio: 20-60:1 (depending on intended use)
✅ Total nitrogen (N): 0.5-3%
✅ Phosphorus (P₂O₅): ≥0.5%
✅ Potassium (K₂O): ≥1%
✅ pH level: 6-10 (choose according to soil type)
✅ CEC: ≥30 cmol/kg
✅ Moisture: <15%
✅ Ash content: <30%
Additional indicators (if any):
- Heavy metals (Pb, Cd, As, Hg): Must be below permissible limits
- Surface area (BET): >100 m²/g is good
- Porosity: Useful information about structure
Quick home test for biochar quality (simple method)
Not everyone has the means to send samples for analysis. Below are the simple tests you can do at home:
Test 1: Check color and structure
- Good biochar: Shiny black, uniform, with visible porous structure
- Poor biochar: Gray, brown, uneven, lots of fine dust
Test 2: Check water retention capacity
- Put 100g of biochar into a cup
- Slowly pour 200ml of water
- Good biochar will absorb all the water within 5–10 minutes
- Poor biochar: Water pools and isn't absorbed
Test 3: Check bulk density
- Weigh 1 liter of biochar (lightly tamped)
- Good biochar: 150-300 g/L (light, porous)
- Poor biochar: >400 g/L (heavy, compact)
Test 4: Simple pH test
- Soak 10 g of biochar in 100 mL of distilled water
- Stir well, let stand for 1 hour
- Check with pH paper or a pH meter
Test 5: Odor test
- Good biochar: No odor or a slight charcoal smell
- Poor biochar: Burnt smell, chemical odor, or sour smell
Summary table of six indicators for high-quality biochar
QUICK REFERENCE TABLE - BIOCHAR QUALITY STANDARDS
| Indicator | Minimum level | Ideal level | Premium level | Notes |
|---|---|---|---|---|
| Carbon (C) | ≥60% | 70-80% | >80% | Backbone of biochar |
| C/N ratio | 20:1 | 30-40:1 | 40-60:1 | Depends on plant type and purpose |
| Nitrogen (N) | ≥0.5% | 1-2% | >2% | Generally low, requires supplementation |
| Phosphorus (P₂O₅) | ≥0.5% | 1-3% | >3% | Important for roots and flowers |
| Potassium (K₂O) | ≥1% | 2-5% | >5% | Improves stress tolerance |
| pH | 6-10 | 7-9 | 8-10 (acidic soil) | Choose by soil type |
| CEC | ≥20 cmol/kg | 30-50 cmol/kg | >50 cmol/kg | Nutrient retention capacity |
| Moisture | <20% | <15% | <10% | Impact on storage |
| Ash content | <40% | <30% | <20% | High ash = low carbon |
How to use the table:
- Compare the certificate against the table above
- Prioritize metrics at the "Ideal" level or above
- Accept "Minimum" if reasonably priced and compensated for in other ways
- Avoid products below "Minimum"
Case Study: Comparing Real-World Performance of Standard-Compliant vs Non-Compliant Biochar
Case 1: Đắk Lắk coffee farm using biochar that meets standard specifications
Basic information:
- Location: Xã Cư M'gar, Cư M'gar District, Đắk Lắk
- Area: 2 ha of 7-year-old Robusta coffee
- Soil type: Basalt soil, pH 5.8, nutrient-poor due to long-term cultivation
- Biochar used: From coffee husks, pyrolyzed at 550°C
Biochar properties:
- Carbon: 72%
- C/N ratio: 45:1
- P2O5: 1.8%
- K2O: 4.2%
- pH: 8.5
- CEC: 38 cmol/kg
Application method:
- Dosage: 3 tons/ha (1.5 kg/tree)
- Mixed evenly with 30% farmyard manure, composted for 3 weeks
- Applied into trenches 20 cm deep, 50 cm from the tree base
- Supplementary NPK reduced by 25% compared to usual rates
Results after 2 seasons (18 months):
- Yield increase: 18% (from 3.2 tons to 3.78 tons/ha)
- Fertilizer savings: 28% (reduced from 450 kg NPK to 324 kg/ha/year)
- Coffee quality: Grade A bean percentage increased from 62% to 71%
- Trees healthier, less branch dieback during the dry season
- ROI: Payback period 1.5 years
Costs - profits:
- Biochar investment: 18 million VND (3 tons × 6 million VND/ton)
- Fertilizer savings: 5.6 million VND/year
- Increased income from yield: 15.2 million VND/year
- Additional net profit: 20.8 million VND/year
Case 2: An Giang rice field using low-quality biochar
Basic information:
- Location: Chau Phu District, An Giang
- Area: 1.5 ha of OM 5451 rice
- Soil type: Alluvial, pH 6.2
- Biochar used: Unknown origin, bought cheaply
Biochar indicators (checked after purchase):
- Carbon: 48% (low)
- C/N ratio: 85:1 (too high)
- P₂O₅: 0.2% (very low)
- K₂O: 0.6% (low)
- pH: 9.8 (too high)
- CEC: 15 cmol/kg (low)
Application method:
- Dosage: 2 tons/ha
- Applied directly to the field, not pre-composted
- Maintain NPK fertilizer rates as before
Results after 2 seasons:
- Season 1: Rice showed yellowing leaves 3 weeks after transplanting, yield decreased by 8%
- Season 2: Increased nitrogen fertilizer by 30%, yield only matched the season before biochar application
- Soil pH rose to 7.1 (undesirable for rice)
- Uneven crop growth
- Total loss: 12 million VND (biochar cost + reduced yield + increased fertilizer)
Causes of failure:
- High C/N → severe nitrogen immobilization (competition for N)
- Low P and K → nutrients were not supplemented
- High pH → caused soil alkalinization
- Low CEC → poor nutrient retention
Data analysis: Yield, costs, profit after 2 seasons
DETAILED COMPARISON TABLE
| Indicator | Coffee plantation (good biochar) | Rice field (poor biochar) |
|---|---|---|
| Biochar investment | 18 million | 10 million |
| Change in yield | +18% | -8% (season 1), 0% (season 2) |
| Change in fertilizer costs | -28% | +30% (season 2) |
| Change in product quality | Significant increase | No change |
| Net profit per year | +20.8 million | -12 million |
| ROI | 115% after 18 months | -120% |
| Evaluation | Success | Failure |
Lessons learned:
- The price difference for biochar (6 million vs 5 million per ton) is not significant
- But the difference in results is very large: +20.8 million vs -12 million
- Investing in quality biochar is a smart investment
- Checking the specifications before purchase is required
Lessons from real production experience
Lesson 1: Don't just look at the price Cheap biochar can cost you more. Calculate based on overall economic effectiveness, not just the initial cost.
Lesson 2: Always request certification A reputable supplier will be willing to provide it. If they refuse or evade, that's a warning sign.
Lesson 3: Test on a small scale first Never invest in your entire area the first time. Try on 10-20% of the area, and monitor results for 1-2 seasons.
Lesson 4: Combining biochar with organic fertilizers Biochar is not a 'magic bullet'. Its effectiveness is highest when combined with manure, compost, and good soil management.
Lesson 5: Choosing the right biochar for crops Coffee needs K-rich biochar; rice needs biochar with a lower pH. There is no 'universal' biochar for every crop.
Conclusion: Smart Investment in Quality Biochar
Summary of the 6 most important nutrient indicators
After going through the full detailed analysis, we can summarize 6 golden indicators to evaluate biochar:
1. Carbon content (C) ≥ 60%: Foundation of porous structure, water retention, and nutrient holding capacity.
2. C/N ratio = 20-60:1: Balance between long-term soil improvement and avoiding nitrogen competition.
3. Nitrogen content (N) ≥ 0.5%: Although low, it is important to know for proper supplementation.
4. Phosphorus content (P₂O₅) ≥ 0.5%: Supports root development and flowering/fruiting.
5. Potassium content (K₂O) ≥ 1%: Enhances resistance and product quality.
6. pH and CEC: pH 6-10 (choose based on soil), CEC ≥ 30 cmol/kg for effective nutrient retention.
Remember that, no indicator works in isolationThey interact with each other and together determine the overall effectiveness of biochar.
Final advice for farmers and producers
For farmers:
✅ Learn how to read certificates - This is a smart investment skill
✅ Don't hesitate to ask your supplier - Ask questions about origin, production process, and technical specifications
✅ Small-scale trials before scaling up - Minimize risk, gain experience
✅ Integrate biochar with good agricultural practices - Biochar is a tool, not the only solution
✅ Join farmer groups - Learn practical experience from more experienced farmers
For biochar producers:
✅ Invest in quality testing - Certification is a major competitive advantage
✅ Transparent product information - Build trust with customers
✅ Classify products by intended use - Biochar for vegetables, perennial crops, acidic soils...
✅ Provide detailed usage instructions - Helping customers succeed = business growth
Trends in high-quality biochar development in Vietnam
Vietnam's biochar market is positively evolving:
Trend 1: More advanced production technology Investments are being made in kilns with precise temperature control, energy recovery, and emission reduction.
Trend 2: Functionalization of biochar Biochar is enriched with nutrients, combined with microorganisms, creating highly efficient hybrid products.
Trend 3: Quality standardization National standards for biochar are being developed, creating a clear legal framework.
Trend 4: Applications in high-tech agriculture Biochar is integrated into greenhouse systems, hydroponic vegetable cultivation, and organic agriculture.
Trend 5: Value chain integration From waste collection → biochar production → application → procurement of agricultural produce, creating a closed-loop chain.
Now is a good time to farmers and businesses to collaborate, building a sustainable biochar ecosystem in Vietnam.
Call-to-action: Download checklist or contact for consultation
BIOCHAR ASSESSMENT CHECKLIST - FREE DOWNLOAD
We have condensed all the knowledge from the article into a 1-page checklist to help you:
- Quickly assess biochar quality when buying
- Compare suppliers
- Calculate appropriate application rates
- Track effectiveness after application
Take action now:
📋 Download the free checklist at [website link]
📞 Sign up for a free consultation with agronomy experts on selecting and using biochar suited to your crops
👥 Join the community "Sustainable Agriculture with Biochar" to share experiences and learn from others
🌱 Subscribe to the newsletter to keep up with the latest research on biochar and soil restoration technologies
Remember that: High-quality biochar is not only an investment in current yields, but also a fertile legacy you leave to the land and to future generations. The carbon in biochar can persist for hundreds of years, turning each biochar application into a long-term investment for the health of agricultural soils.
Start your sustainable soil restoration journey today — with the right knowledge and smart choices!